Observability: Seeing Inside Your Systems Before They Break

Modern systems are like black boxes—complex, distributed, and full of moving parts. When something goes wrong, how do you know where and why? That’s where observability comes in. It’s not just about collecting logs; it’s about gaining real insight into your system’s behavior, so you can fix issues before they become outages.
Imagine you’re running a high-traffic e-commerce site. Suddenly, users start complaining that their orders aren’t going through. Is it a database issue? A payment gateway timeout? A bug in the frontend? Without observability, you’re left guessing. With it, you can pinpoint the problem, understand its impact, and resolve it quickly—sometimes before users even notice.
In this post, we’ll go beyond the basics and explore how to make your systems truly observable, with practical examples, advanced techniques, and real-world war stories.
What is Observability?
Observability is the ability to understand what’s happening inside your system just by looking at its outputs. Think of it as the difference between driving a car with a dashboard (speedometer, fuel gauge, warning lights) and driving blindfolded.
It’s not just about collecting data—it’s about making sense of it. True observability means you can answer new questions about your system without shipping new code. For example: “Why did latency spike for users in Europe last night?” or “Which microservice is causing the checkout flow to slow down?”
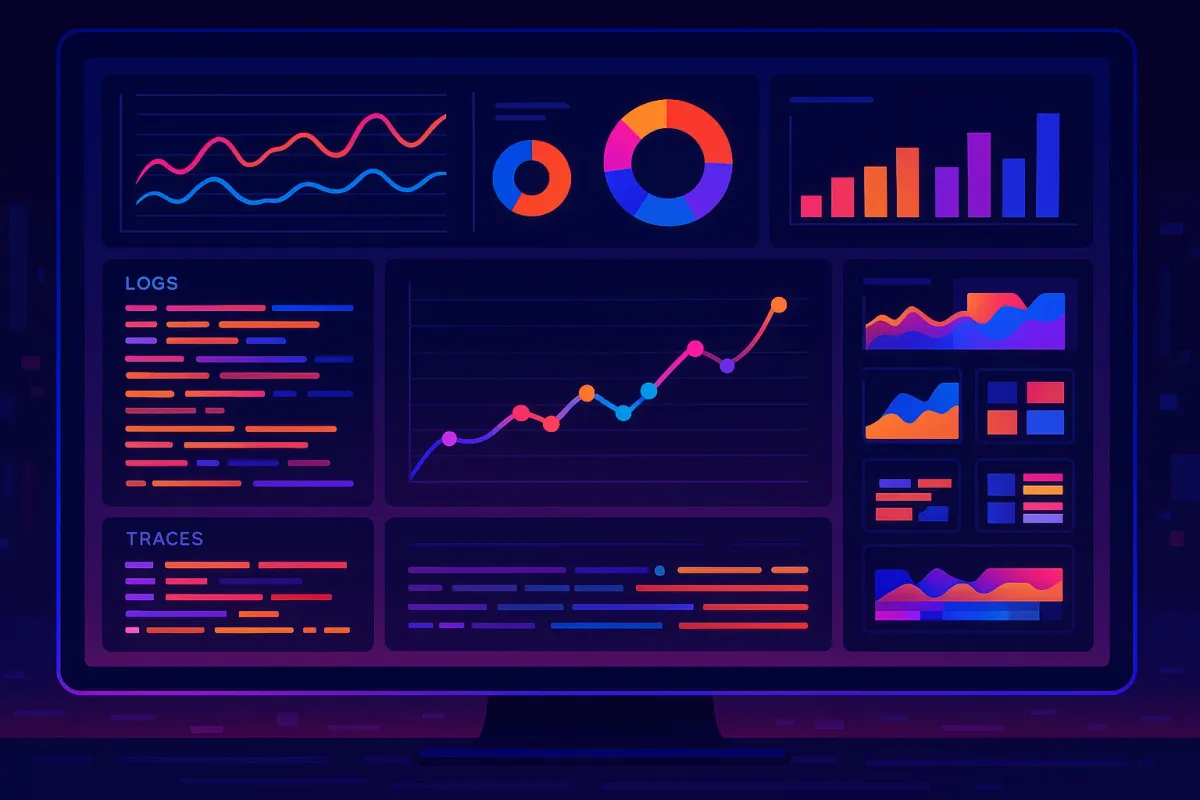
The Three Pillars of Observability
- Logs: Text records of events—errors, warnings, and info messages. Good logs are structured (e.g., JSON), include context (user ID, request ID), and are easy to search.
- Metrics: Numeric measurements over time—CPU usage, request rates, error counts. Metrics help you spot trends, set alerts, and understand system health at a glance.
- Traces: End-to-end records of requests as they flow through your system. Traces let you follow a single user’s journey across services, revealing bottlenecks and hidden dependencies.
These pillars work best together. For example, a spike in error metrics can trigger you to look at logs for details, and traces to see which service is slow.
Why Does Observability Matter?
- Faster debugging: Find and fix issues quickly. When an incident happens, you want to go from "something’s wrong" to "here’s the root cause" in minutes, not hours.
- Proactive alerts: Get notified before users notice problems. Good observability lets you set up alerts for symptoms (like rising latency or error rates), not just outages.
- Better understanding: See how features perform in the real world. Are users actually using that new feature? Is it slower than expected?
- Capacity planning: Metrics help you predict when you’ll need to scale up resources.
- Compliance and auditing: Logs provide a record of what happened and when, which is crucial for regulated industries.
Real-World Scenario: The Mystery of the Slow Checkout
Suppose your checkout process is suddenly taking 10 seconds instead of 1. With good observability:
- Metrics show a spike in checkout latency.
- Traces reveal the delay is in the payment microservice.
- Logs show repeated timeouts to the payment gateway.
You quickly identify the root cause (a third-party outage) and can communicate with users, implement a fallback, or switch providers. Without observability, you’d be flying blind.
Comprehensive Example: Observability in a Node.js Microservice
Let’s build a more realistic example. Imagine a Node.js service that handles user registrations. We’ll add structured logging, metrics, and distributed tracing using OpenTelemetry.
const express = require('express');
const { MeterProvider } = require('@opentelemetry/sdk-metrics-base');
const { NodeTracerProvider } = require('@opentelemetry/sdk-trace-node');
const { trace, context } = require('@opentelemetry/api');
const app = express();
app.use(express.json());

// Set up metrics
const meter = new MeterProvider().getMeter('user-service');
const registrationCounter = meter.createCounter('user_registrations', {
  description: 'Count of user registrations',
});

// Set up tracing
const tracerProvider = new NodeTracerProvider();
tracerProvider.register();
const tracer = trace.getTracer('user-service');

// Structured logging
function log(level, message, extra = {}) {
  console.log(JSON.stringify({
    level,
    message,
    timestamp: new Date().toISOString(),
    ...extra,
  }));
}

app.post('/register', (req, res) => {
  const span = tracer.startSpan('register_user');
  context.with(trace.setSpan(context.active(), span), () => {
    const { username } = req.body;
    // Simulate registration logic
    registrationCounter.add(1);
    log('info', 'User registered', { username });
    span.end();
    res.status(201).json({ message: 'User registered' });
  });
});

app.get('/metrics', (req, res) => {
  // In a real app, export Prometheus metrics here
  res.json({ registrations: 'see Prometheus endpoint' });
});

app.listen(3000, () => {
  log('info', 'User service running on port 3000');
});
What’s happening here?
- Every registration is logged as a structured JSON event.
- A metric tracks the number of registrations.
- Each request is traced, so you can see how long registration takes and where it might be slow.
In production, you’d export metrics to Prometheus, logs to ELK or Loki, and traces to Jaeger or Zipkin. This gives you a full view of your service’s health and performance.
Advanced Observability Techniques
- Instrument early and often: Add logging, metrics, and tracing from the start, and keep improving as your system evolves.
- Centralize and correlate data: Use tools like ELK Stack, Prometheus, Grafana, Loki, Jaeger, or Honeycomb. Correlate logs, metrics, and traces using request IDs.
- Alert on symptoms, not just failures: Set up alerts for slowdowns, error spikes, or unusual patterns—not just outages. Alert fatigue is real, so tune your thresholds.
- Use distributed tracing: In microservices, traces are essential for finding bottlenecks and understanding dependencies.
- Monitor business metrics: Track not just technical health, but also business outcomes (e.g., registrations per hour, revenue per minute).
- Embrace SLOs and SLIs: Define Service Level Objectives (SLOs) and Indicators (SLIs) to measure what matters to users, not just servers.
- Chaos engineering: Regularly inject failures to test your observability and incident response.
- Automate root cause analysis: Use AI/ML tools to spot anomalies and suggest likely causes.
Common Pitfalls
- Too much data, not enough insight: Collecting logs is easy; making them useful is hard. Focus on actionable signals.
- Missing context: Always include request IDs, user IDs, and other context in your logs and traces.
- Siloed tools: Integrate your observability stack so you can jump from an alert to logs to traces seamlessly.
Conclusion: Make Your Systems Observable—Not Just Monitored
Observability turns the lights on in your system. It’s the difference between reacting to outages and preventing them. With the right data, tools, and mindset, you can:
- Catch problems early
- Understand user impact
- Build more reliable, trustworthy software
Don’t wait for the next outage—start making your systems observable today. Invest in the right tools, foster a culture of curiosity, and keep asking new questions about your systems.
How do you approach observability in your projects? Share your favorite tools, stories, and tips below!